Staff stability
Improving
Source: Kolada (municipality-aggregated certified teacher trend).

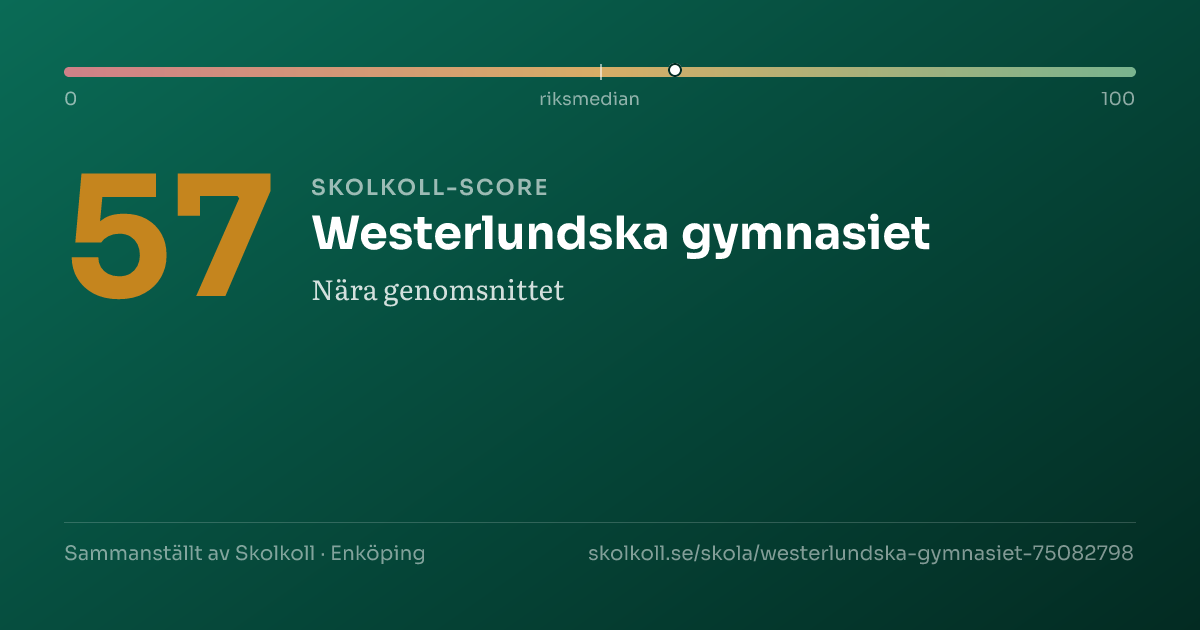
A composite of five open data sources — a starting point, not a grade.
Skolkoll score is Skolkoll's composite indicator based on available data sources. It is not an official quality measure and should be read together with the underlying data.
3 of 5 score dimensions have school-specific data.
When school-specific data is missing for a dimension, the neutral value 50 is used. That does not automatically lower the school, but it makes the score less informative.

Westerlundska gymnasiet is a large municipal upper secondary school with 1,500 pupils.
Westerlundska gymnasiet is a large municipal upper secondary school with 1,500 pupils. The share of qualified teachers (88%) is above the national average of 78%. Skolverket: unweighted school-unit mean, upper-secondary schools with published data; latest available value per school.
See how schools in Enköping rank →
Apply for a place? Use Enköping e-service for upper-secondary application (opens in a new window).
This applies only to the values listed here.
There is still too little history to interpret the trend safely.
This affects
Other values here do not have this specific note.
No clear attention flags from key-figure deviations or the part of the School Inspectorate's register we import. Detailed inspection history is shown in the "Safety & Inspection" card below.
The school's strengths compared with all upper-secondary schools nationally.
Source: Skolverket, Swedish Schools Inspectorate.
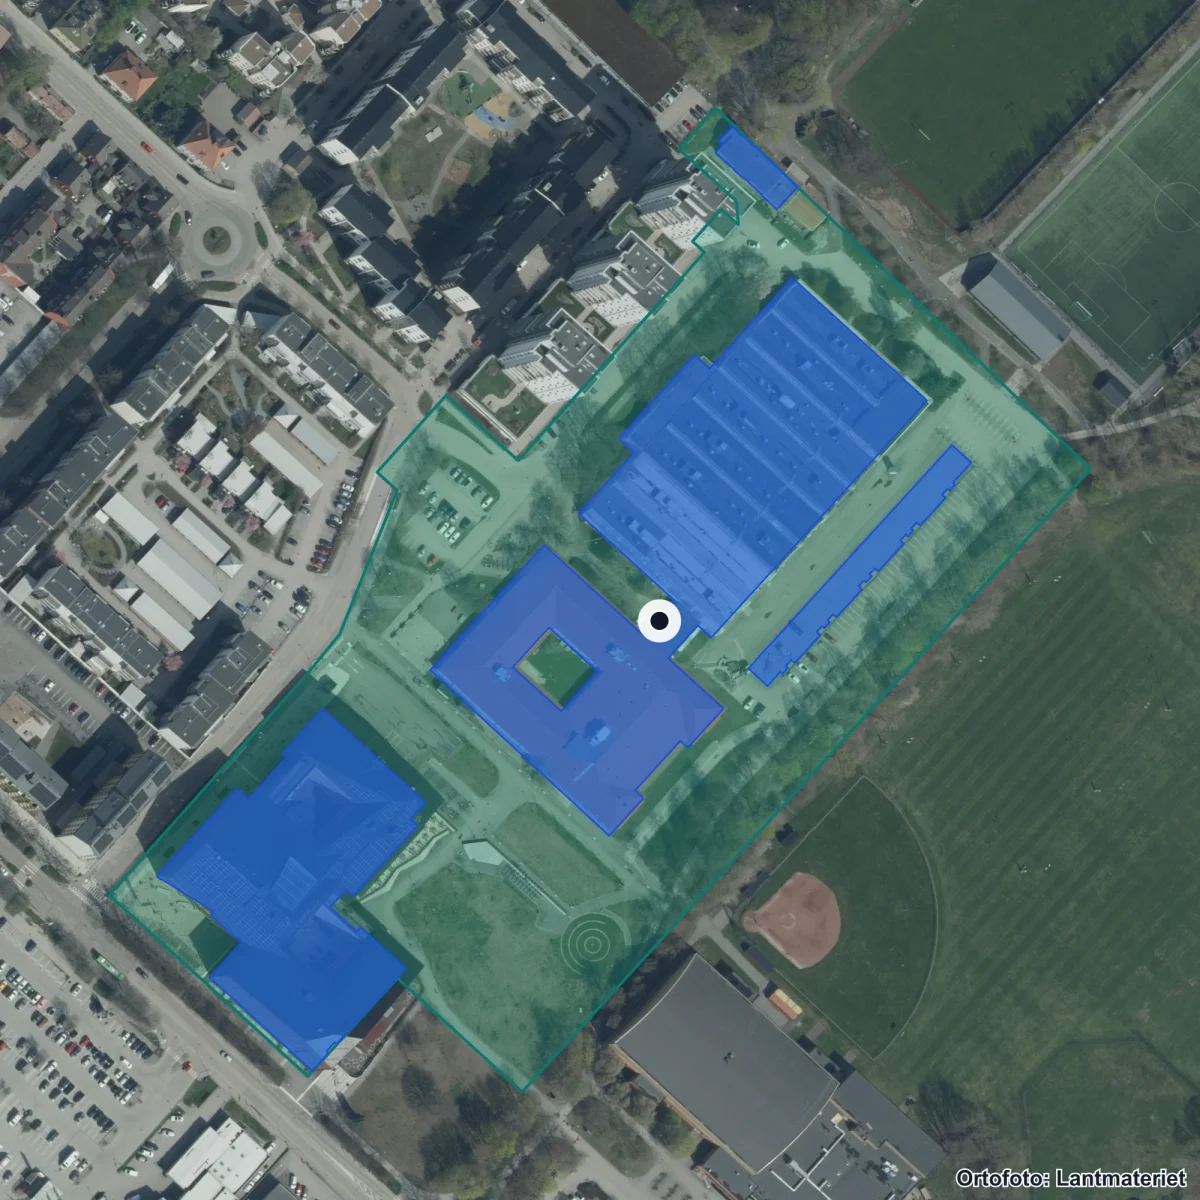
The school's property boundary and buildings from the Swedish Land Survey's property register. Updated 2026. Source: Lantmäteriet · CC BY 4.0
Entrances:1 Enköping, Sandbrogatan 2D, Enköping
Sweden: 14.0
Average graduation grade is 0.1 points below the national average.
| Programme | Avg. | Sweden | Difference |
|---|---|---|---|
| Bygg- och anläggningsprogrammet | 190 p · Historical 2025 | — | |
| Barn- och fritidsprogrammet | 130 p · Historical 2025 | — | |
| El- och energiprogrammet | 215 p · Historical 2025 | — | |
| Ekonomiprogrammet | 160 p · Historical 2025 | — | |
| Estetiska programmet | 140 p · Historical 2025 | — | |
| Försäljnings- och serviceprogrammet | 197.5 p · Historical 2025 | — | |
| Fordons- och transportprogrammet | 95 p · Historical 2025 | — | |
| Naturvetenskapsprogrammet | 192.5 p · Historical 2025 | — | |
| Restaurang- och livsmedelsprogrammet | 172.5 p · Historical 2025 | — | |
| Samhällsvetenskapsprogrammet | 205 p · Historical 2025 | — | |
| Teknikprogrammet | 207.5 p · Historical 2025 | — | |
| Vård- och omsorgsprogrammet | 145 p · Historical 2025 | — |
Lowest admitted merit score from the most recent published admission round; the year is stated per programme. Scores marked "average" are Skolverket's average admission score, published when the lowest admitted score is unavailable. Smaller programmes (under 20 places) have larger year-to-year variation.
| Outcome | Share |
|---|---|
| In further studies (national programmes) | 50.4% |
| Established in the labor market (national programmes) | 37.2% |
| In further studies (introduction programmes) | 28.9% |
| Established in the labor market (introduction programmes) | 26.7% |
Source: Skolverket Statistikdatabasen (per school unit, 3 years after graduation). Rows are independent outcome metrics and do not sum to 100%. One-year follow-up and a university-vs-other-studies split are not published in open data per school.
Sweden: 78% · Skolverket: unweighted school-unit mean, upper-secondary schools with published data; latest available value per school
88% certified teachers — 10 percentage points above the national average.
2 registered inspection decision(s) with deficiencies. We could not classify 4 of 6 inspection documents. Latest document: 2017. Our inspection data is incomplete: it mainly covers regular and targeted inspections, and most quality reviews are still missing.
Source: Schools Inspectorate + Skolverket · Last updated: 5 Oct 2026
Sweden: 144,800 SEK
Cost per pupil is 8% below the national average.
56 other schools in the municipality.

ENKÖPINGS KOMMUN is the operator. The municipality has 56 other schools.
Source: Skolverket · Last updated: 6 Oct 2026
Apply through Enköping e-service for upper-secondary application.
75082798Source: Skolverket School Unit Register · Pipeline-fetched on 2026-10-06.
Everyday travelAreas that reach the school within 15 minutes.
School-form averages across the municipality, with links to deep-dive sub-pages.
Source: Skolverket (aggregated school statistics).
The 5 most-similar upper secondary schools based on student count, geography, teacher certification and pupil composition.
Get email when new statistics are published, merit value changes significantly or the School Inspectorate makes a new decision.
The Data view shows complete history, sources, methodology and CSV export.
Source: Kolada (municipality-aggregated certified teacher trend).
Trend over time
Trends are shown only when the same indicator and source has at least two comparable years. Missing years, too few responses, and low response rates are marked.
+0.1change between first and latest comparable year
Source: Pupils upper-sec. year 2 · missing years: 2025
-0.7change between first and latest comparable year
Source: Pupils upper-sec. year 2 · missing years: 2025
Weekly menus and meal provider for this school's municipality.
Meal menu provider: Skolmaten.se
Kommunen publicerar skolmenyer via skolmaten.se.
No menu provider registered for this municipality yet.
Source: municipality's own meal portal — Skolkoll does not host menu content.
Source: Schools Inspectorate decisions via Skolverket's document archive (SIRIS). Our inspection data is incomplete: it mainly covers regular and targeted inspections, and most quality reviews are still missing. · See all decisions and review types in the data view → · Search all decisions and reviews at the Schools Inspectorate (in Swedish) ↗
Applicants per place and latest admission cutoff per programme (2025).
High demand reflects popularity, which depends on location and reputation as well as quality. Cutoffs measure entry difficulty, not school quality.
Source: Gymnasieantagningen (regional admission databases). Latest year: 2025.
Source: Skolverket (graduation rate within 3 years). Updated annually.
Source: Skolverket (higher-education eligibility).
More context about Westerlundska gymnasiet, its municipality, operator and similar schools.
Data coverage
Open school data is not complete. Use this as a checklist for what to verify with the school, provider or municipality.
Work at this school? Embed an image showing the school's Skolkoll score that links to the full profile. The image is served from Skolkoll's image host and updates when we publish a new badge for the school.
See Data view for full sources and fetch dates per source.
