
Stenhammarskolan in Flen
42
Skolkoll Score 42 out of 100. The scale goes from 0 (lowest) to 100 (highest). Composite index.Composite indexA composite index on a 0–100 scale. The number is not a percentile or the share of schools with a lower score. 50 is the scale midpoint, not a measured national average.Skolkoll score · scale 0–100
A composite of five open data sources — a starting point, not a grade.
The score reflects results directly. Given the pupil intake, the school performs better than expected — see value-added.
Data coverageHigh4/5
Why this score?
Skolkoll score is Skolkoll's composite indicator based on available data sources. It is not an official quality measure and should be read together with the underlying data.
4 of 5 score dimensions have school-specific data.
When school-specific data is missing for a dimension, the neutral value 50 is used. That does not automatically lower the school, but it makes the score less informative.
Performs better than the pupil intake predictsA statistical model that compares schools’ results with what is expected given the student composition.Read more in glossary →What is value-added?The school's own contribution given its pupil intake (Skolverket's SALSA model) — not a quality guarantee, and not comparable between years.
Info
Foto: Stockholm100 · CC BY 4.0 · Wikimedia Commons · Modifierad
AI-stylised illustration, not a photo of the school.
Report an issue with this imageStenhammarskolan is a large municipal compulsory school with 620 pupils.
Stenhammarskolan is a large municipal compulsory school with 620 pupils. The share of qualified teachers (65%) is below the national average of 72%. Skolverket: unweighted school-unit mean, compulsory schools with published data; latest available value per school.
- Pupils
- 620High reliability
- Municipality: 1,450
- Qualified teachers
- 65%High reliability
- Municipality: 52% · Sweden: 72% (Skolverket: unweighted school-unit mean, compulsory schools with published data; latest available value per school)
- Year 9 merit value
- 206.3Moderate reliability
- Municipality: 218.6 · Sweden: 227.6
- Pupils per teacher
- 10.4High reliability
- Municipality: 10.6 · Sweden: 11.9
- Cost per pupil (municipal avg.)
- 164,672 SEKLimited history
- Sweden: 144,800 SEK
See how schools in Flen rank →
The most important facts in 3 points
- Compulsory school in Flen with 620 pupils.
- The latest record (2024) is a review or decision without risk classification.
- Applying? Go to the school's application link on this page.
Skolkoll interpretation
Stenhammarskolan is compared here with 7 other schools with the same school form in Flen municipality; it has 620 pupils versus the municipal average of 181.
The year-9 merit value is 206.3, 12.3 points below the municipal average and 21.3 points below the national average.
Qualified teachers: 65%, 13 percentage points above the municipal average and 7 percentage points below the national average. Skolverket: unweighted school-unit mean, compulsory schools with published data; latest available value per school.
The SALSA residual (+29.0) indicates that outcomes are stronger than the model expects for the pupil composition.
Apply for a place? Use Flen e-service for school choice (opens in a new window).
School programmes
- Compulsory school
Things to look into
No clear flag.
No clear attention flags from key-figure deviations or the part of the School Inspectorate's register we import. Detailed inspection history is shown in the "Safety & Inspection" card below.
School profile
The school's strengths compared with all primary schools nationally.
- Merit ratingP21
- Certified teachersP26
- Pupil-teacher ratioP73
- Eligibility (upper secondary)P2
Percentiles compare schools with each other, not individual pupils. What is a good merit value?
Source: Skolverket, Swedish Schools Inspectorate.
Aerial view of the school
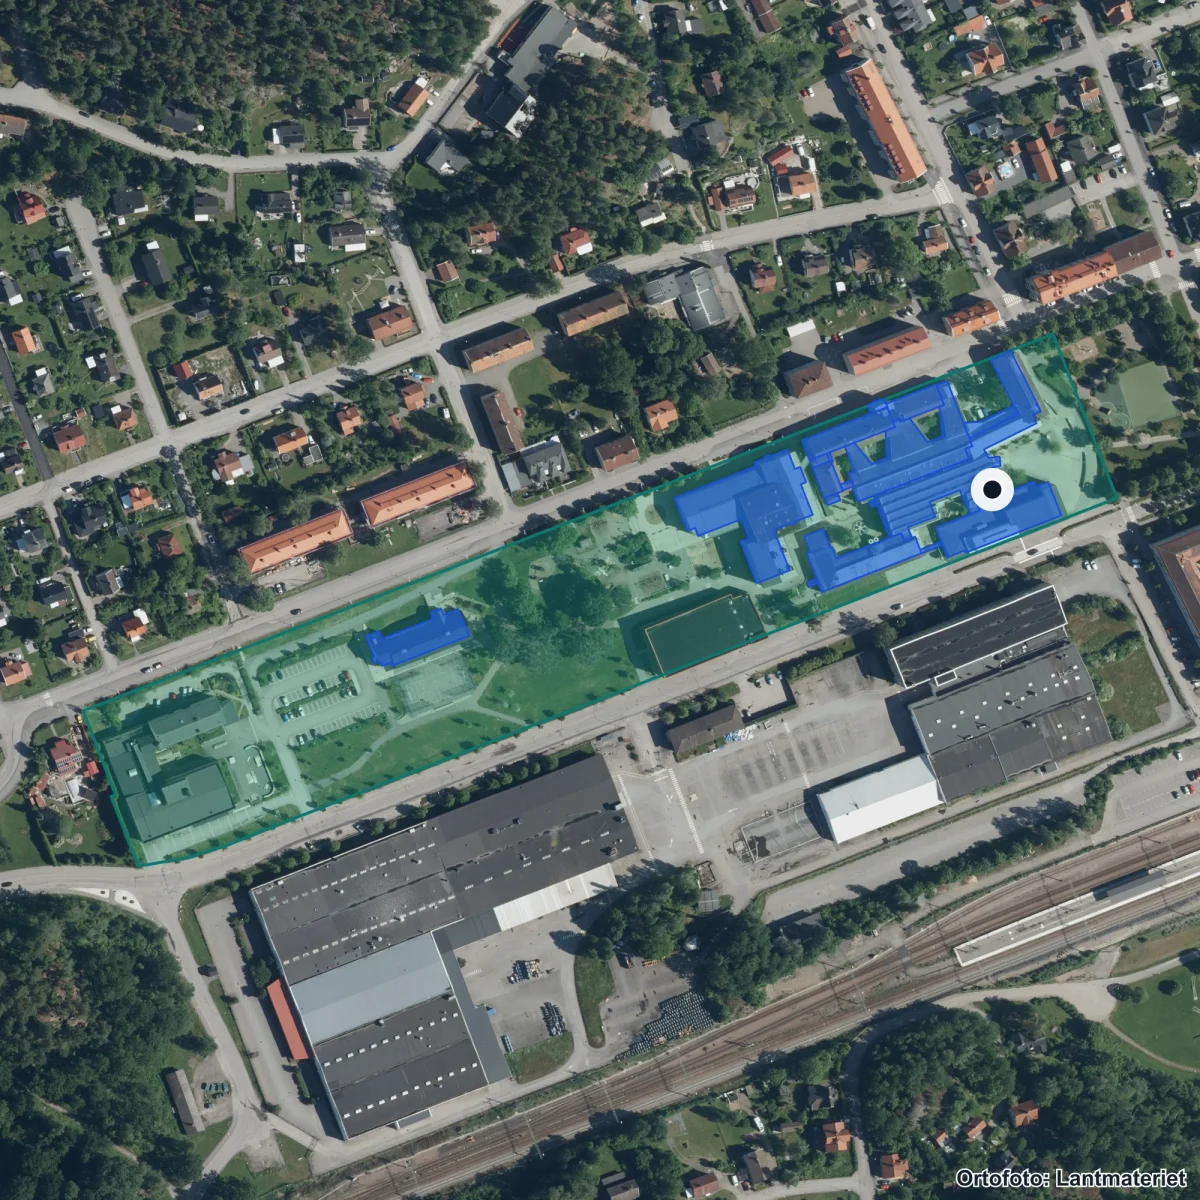
The school's property boundary and buildings from the Swedish Land Survey's property register. Updated 2026. Source: Lantmäteriet · CC BY 4.0
Entrances:1 Flen, Drottninggatan 16, Flen
School performance
Results
206.3Merit value yr 9Sweden: 227.6
Results
206.3
Merit value yr 9
Results are reported by the school operator to Skolverket.
- Merit value yr 9 Reliability: High reliability.
- 206.3From 216.7 (2425) to 206.3 (2526)Change within uncertainty intervalSweden: 227.6
- SVA test-takers yr 6 Reliability: High reliability.
- ≥10 test-takers
- SVA test-takers yr 9 Reliability: High reliability.
- ≥10 test-takers
High reliability — Direct data from the school operator.
Staff
65%Qualified teachersMunicipality: 52% · Sweden: 72% · Skolverket: unweighted school-unit mean, compulsory schools with published data; latest available value per school
Staff
65%
Qualified teachers
65% certified teachers — 7 percentage points below the national average.
- Qualified teachers Reliability: High reliability.
- 65%From 58% (2425) to 65% (2526)Municipality: 52% · Sweden: 72% · Skolverket: unweighted school-unit mean, compulsory schools with published data; latest available value per school
- Pupils per teacher Reliability: High reliability.
- 10.4From 12.7 (2425) to 10.4 (2526)Municipality: 10.6 · Sweden: 11.9
- Permanently employed Reliability: Moderate reliability.
- 88%
- Senior teachers (förstelärare) Reliability: Moderate reliability.
- No dataThe Swedish National Agency for Education has not published this value.No data — the Swedish National Agency for Education has not published this value.
- Pupils per counsellor Reliability: Moderate reliability.
- 882.1
- Certified in their teaching subject Reliability: Moderate reliability.
- 58%
- Teachers (FTE) Reliability: Moderate reliability.
- 82.9
- Share of female teachers Reliability: Moderate reliability.
- 76%
Moderate reliability — Mixed sources: certification + student/teacher ratio reported directly to Skolverket; other personnel fields from Skolverket's annual Personal report (1-2 year data lag).
Value-added / SALSA
+29.0SALSA residualModel prediction: 188.0 · Actual outcome: 217.0
Value-added / SALSA
+29.0
SALSA residual
The school performs above what the student composition would predict.
- Model prediction Reliability: Moderate reliability.
- 188.0
- Actual outcome Reliability: Moderate reliability.
- 217.0
Moderate reliability — SALSA models have natural uncertainty for small schools.
School environment
Safety & Inspection
No classified deficienciesLatest inspection in our data: 2024
Safety & Inspection
No classified deficiencies
Latest inspection in our data: 2024
We could not classify the outcome of the school's 1 inspection document(s); read the decisions. Latest document: 2024. Our inspection data is incomplete: it mainly covers regular and targeted inspections, and most quality reviews are still missing.
- Latest inspection document Reliability: High reliability.
- 2024-06-11 — Riktad tillsyn Skolbeslut Grundskola Flen Stenhammarskolan, 2024 (pdf, 175 kB)
- Recorded decisions with deficiencies Reliability: High reliability.
- 0
High reliability — Inspection register and Skolenkäten survey.
Source: Schools Inspectorate + Skolverket · Last updated: 5 Oct 2026
Resources
164,672 SEKCost per pupil (total)Sweden: 144,800 SEK
Resources
164,672 SEK
Cost per pupil (total)
Cost per pupil is 14% above the national average.
Limited history — Cost data updated annually by Kolada/SCB.
Who runs the school
Operator
FLENS KOMMUNMunicipal operator25 other schools in the municipality.
Operator
FLENS KOMMUN
Municipal operator

FLENS KOMMUN is the operator. The municipality has 25 other schools.
- Operator Reliability: High reliability.
- FLENS KOMMUN
- Operating form Reliability: High reliability.
- Municipal own operation
- Other schools in municipality Reliability: High reliability.
- 25
High reliability — Current data from Skolverket and Bolagsverket.
Source: Skolverket · Last updated: 6 Oct 2026
Next step: Apply for a place
Apply through Flen e-service for school choice.
Contact and address
- Visiting address
- Storgatan 19 B, 64237 Flen
- Postal address
- 64281 FLEN
- Phone
- 0157-430540
- buk@flen.se
- Website
- flen.se/
- School unit code
59150456
Source: Skolverket School Unit Register · Pipeline-fetched on 2026-10-06.
Everyday travelAreas that reach the school within 15 minutes.
Reachability from the school
15 min on foot
15 min by bike
School
Support and inclusion
Support and student health
This panel shows sourced support-resource data where available and marks the rest as missing or uncertain. These fields do not affect score or ranking.
Missing or uncertain support-resource fields
- MissingStudent health teamIs there sourced information about student health functions at the school?
- PartialSpecial educatorThe source does not split special educators and special needs teachers per school unit in this model.
- PartialSpecial needs teacherThe source does not split special educators and special needs teachers per school unit in this model.
- MissingSchool nurseIs there sourced information about school nurse resources?
- MissingPsychologistIs there sourced information about psychologist resources?
- MissingStudy and career guidanceIs there sourced information about study and career guidance?
- MissingLanguage supportIs there sourced information about language or mother-tongue support?
- MissingAdaptations and special supportIs there verified process information for adaptations and special support?
- MissingAccessibilityIs there sourced information about physical or pedagogical accessibility?
- MissingContact routeIs there a verified contact route for support questions?
Privacy rule: no individual pupil health, diagnosis, support decision or personal case data may be stored.
Nearest and similar schools
- Sandbäcksskolan22 km away· 560 pupils
- Munktellskolan 7-936 km away· 530 pupils
- British Junior Primary, Eskilstuna34 km away· 540 pupils
About Flen municipality
School-form averages across the municipality, with links to deep-dive sub-pages.
- Schools
- 26
- Avg. merit (yr 9)
- 218.6−9.0
- Certified teachers
- 54%−19 pp
- Pupils per teacher
- 10.3−1.6
Source: Skolverket (aggregated school statistics).
Similar schools
The 5 most-similar compulsory schools based on student count, geography, teacher certification and pupil composition.
Grade distribution
Share of pupils per grade, school year 2025/26.
+1.5Grades close to national-test results — no clear inflation signal.
Source: SIRIS/Skolverket · See full A–F distribution in the data view →
School survey perspectives
Pupils, guardians and staff — same school, different answers
Survey results broken down by respondent group on a 0–10 scale. Groups can experience the same school very differently — notable gaps are highlighted below.
PupilsGuardians
Text summary of the chart:
- Pupils: Safety 8.1, Study environment 5.5, Stimulation 6.6, Support 7.4, Anti-bullying 5.8.
- Guardians: Safety 6.1, Study environment 4.4, Stimulation 6.1, Support 5.9.
Automatically flagged gaps
Guardians report lower safety (6.1) than Pupils (8.1). (on the 0–10 scale)
Guardians report lower support (5.9) than Pupils (7.4). (on the 0–10 scale)
Guardians report lower study environment (4.4) than Pupils (5.5). (on the 0–10 scale)
Guardians report lower stimulation (6.1) than Pupils (6.6). (on the 0–10 scale)
Staff results are not published per school by Skolinspektionen today, so the staff view appears only when available.
SALSA result
+29.0A statistical model that compares schools’ results with what is expected given the student composition.Read more in glossary →Performs above expectationsThe residual is actual minus expected merit value; positive means the school lifts pupils more than the model predicts.
How should SALSA be read?
SALSA is a statistical comparison metric, not a school rating. Small cohorts and individual year groups can create uncertain signals, so read it together with pupil counts, survey data and other sources.
Source: Skolverket/SALSA · See the full comparison table →
Pupils per year
Number of pupils per year group (total 617 pupils). Latest available year from Skolverket (SIRIS).
★ Watch Stenhammarskolan
Get email when new statistics are published, merit value changes significantly or the School Inspectorate makes a new decision.
Want to dig deeper?
The Data view shows complete history, sources, methodology and CSV export.
In-depth metrics
Staff stability
Improving
Source: Kolada (municipality-aggregated certified teacher trend).
Throughput year 6 → year 9
51.4% → 47.8%
- 61 pupils yr 6
- 69 pupils yr 9
Source: Skolverket SIRIS + Skolverket Statistical Database.
Trend over time
Safety and study environment over time
Trends are shown only when the same indicator and source has at least two comparable years. Missing years, too few responses, and low response rates are marked.
Safety
-0.7change between first and latest comparable year
- 20248.2
- 20267.5
Source: Pupils year 8 · missing years: 2025 · low response rate: 2026
Study environment
-1.2change between first and latest comparable year
- 20245.6
- 20264.4
Source: Pupils year 8 · missing years: 2025 · low response rate: 2026
School meals
Weekly menus and meal provider for this school's municipality.
No menu provider registered for this municipality yet.
Source: municipality's own meal portal — Skolkoll does not host menu content.
Inspections & decisions
We have 1 inspection document from the Schools Inspectorate for the school. We have not classified the outcome; read the decisions. Most recent: Jun 2024.
Source: Schools Inspectorate decisions via Skolverket's document archive (SIRIS). Our inspection data is incomplete: it mainly covers regular and targeted inspections, and most quality reviews are still missing. · See all decisions and review types in the data view → · Search all decisions and reviews at the Schools Inspectorate (in Swedish) ↗
Explore further
More context about Stenhammarskolan, its municipality, operator and similar schools.
Compulsory schools in FlenSee all compulsory schools in the municipality with results and comparisons.Schools in FlenOpen the municipality page with all schools, rankings, and local aggregates.Flens kommunSee all schools, municipalities, and core metrics for the same provider.Södermanlands länCompare municipalities and school patterns across the whole county.Merit value year 9Compare year-9 merit values across municipalities and school environments.Certification vs Merit valueSee how the share of certified teachers relates to year-9 merit values.School size by school typeSee how school forms and unit sizes are distributed nationally.School type distributionCompare how school forms are distributed across municipalities and operators.
Data coverage
What we do not know about Stenhammarskolan
Open school data is not complete. Use this as a checklist for what to verify with the school, provider or municipality.
- HighResults and score inputsHigh data coverage: 4 of 5 score dimensions have school-specific data. When school-specific data is missing for a dimension, the neutral value 50 is used. That does not automatically lower the school, but it makes the score less informative.
- HighEligibility and goal attainmentGrades, eligibility and goal-attainment data may be missing, suppressed or available only for some grades and school types.
- PartialResources, teachers and staffTeacher and resource metrics do not always show subject mix, vacancies, student-health workflows or everyday staffing.
- PartialSupport resources and student healthSome support-resource fields have sourced statistics, but several parts are still missing or reported only in aggregate.
- MissingSafety and study environmentWe lack current or displayable survey data about safety and study environment for this school.
- UncertainAdmissions, placement and important datesMunicipal placement rules, queues and important dates require a local source and should be checked with the municipality or school.
- MissingVisits, facilities and everyday environmentWe lack sourced open-house information for this school. Facilities, accessibility and everyday environment are often not open comparable data.
For the school: get your Skolkoll badge
Work at this school? Embed an image showing the school's Skolkoll score that links to the full profile. The image is served from Skolkoll's image host and updates when we publish a new badge for the school.
See Data view for full sources and fetch dates per source.
